A look at how we've helped forestry and environmental organisations turn complex challenges into data-driven outcomes.
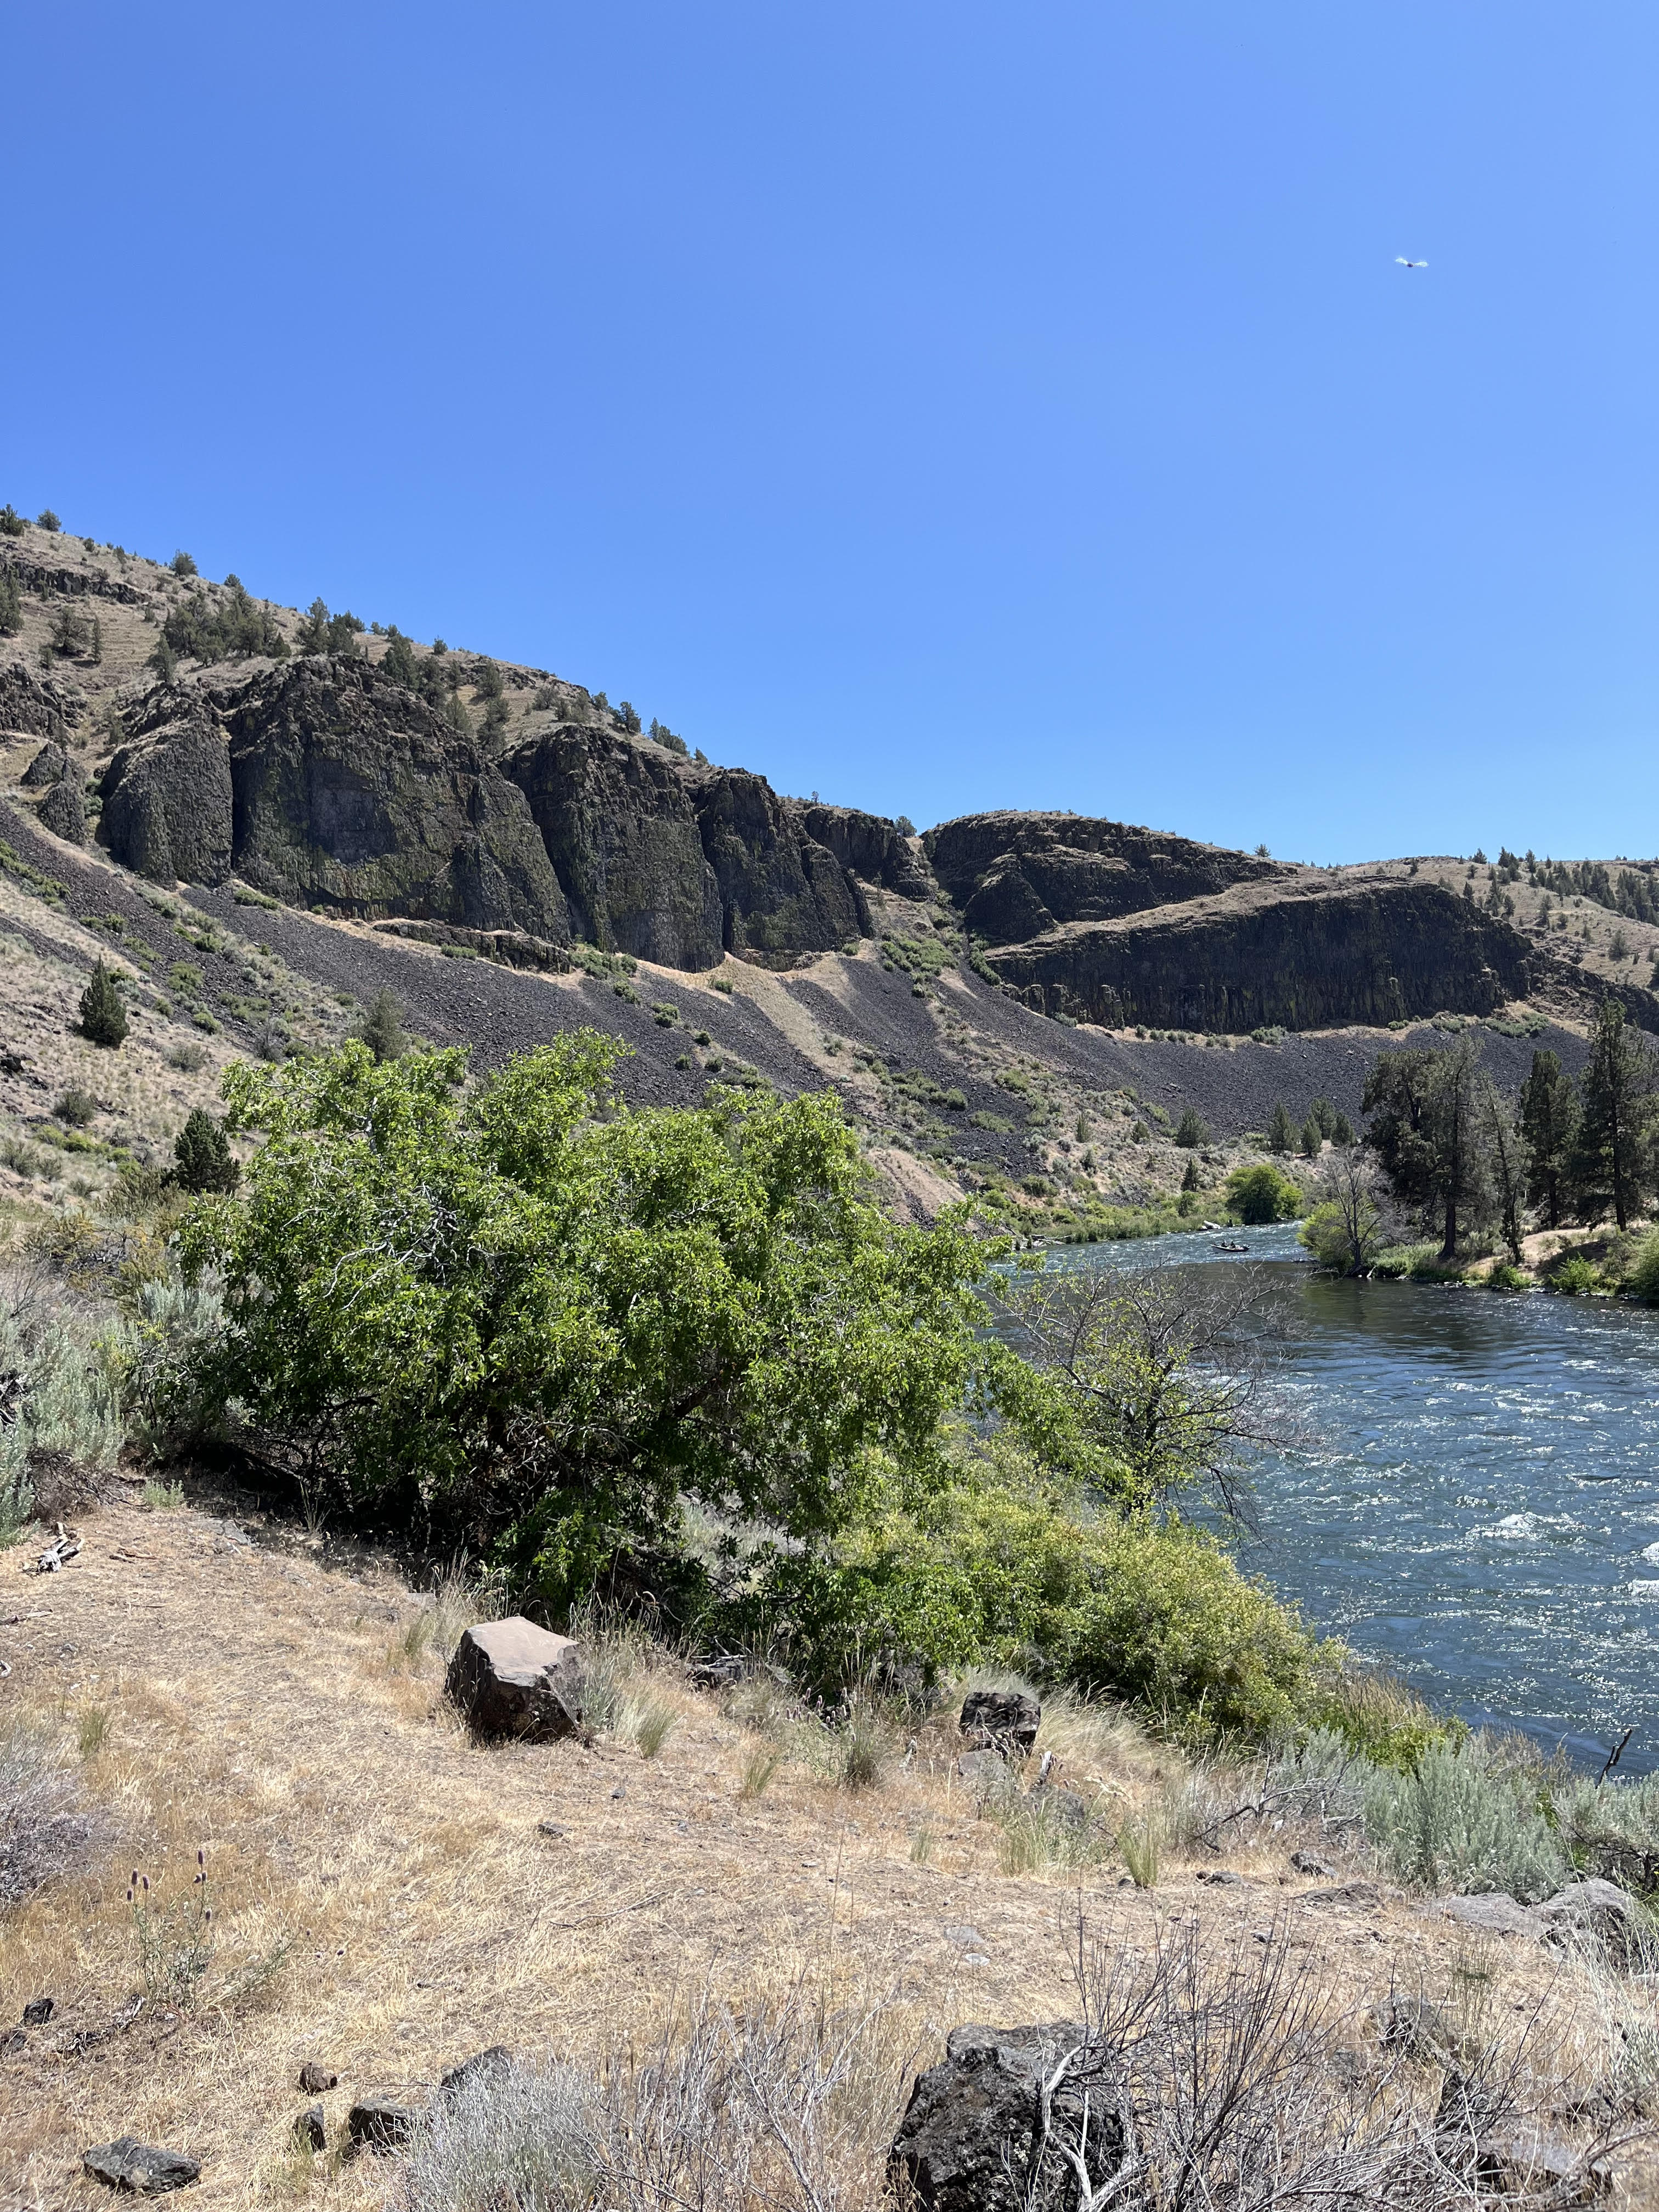
Stream Mapping and Classification
Geospatial intelligence for environmental non-profits
Fisheries Science, Geospatial Support, and Advocacy
Native Fish Society — Oregon Statewide Salmon & Steelhead Mapping
For an organization like the Native Fish Society (NFS), data is plentiful — but turning it into actionable insights is another challenge entirely. Working with Verdant, the NFS set out to develop a statewide map of stream miles where salmon and steelhead
returns could be viewed alongside verified accounts of hatchery influence. Drawing on coarse state-provided data and deep domain expertise from the NFS, Verdant produced a first-of-its-kind map that empowers stakeholders to identify where conservation attention and resources are most needed.
Species — Chum, Fall Chinook, Spring Chinook, and Coho Salmon; Winter and Summer Steelhead.
Tools & Methods — The data gathered was prepared using ArcGIS Pro and SQL queries. The project website was developed from scratch in the ArcGIS Online Web Map Creator.
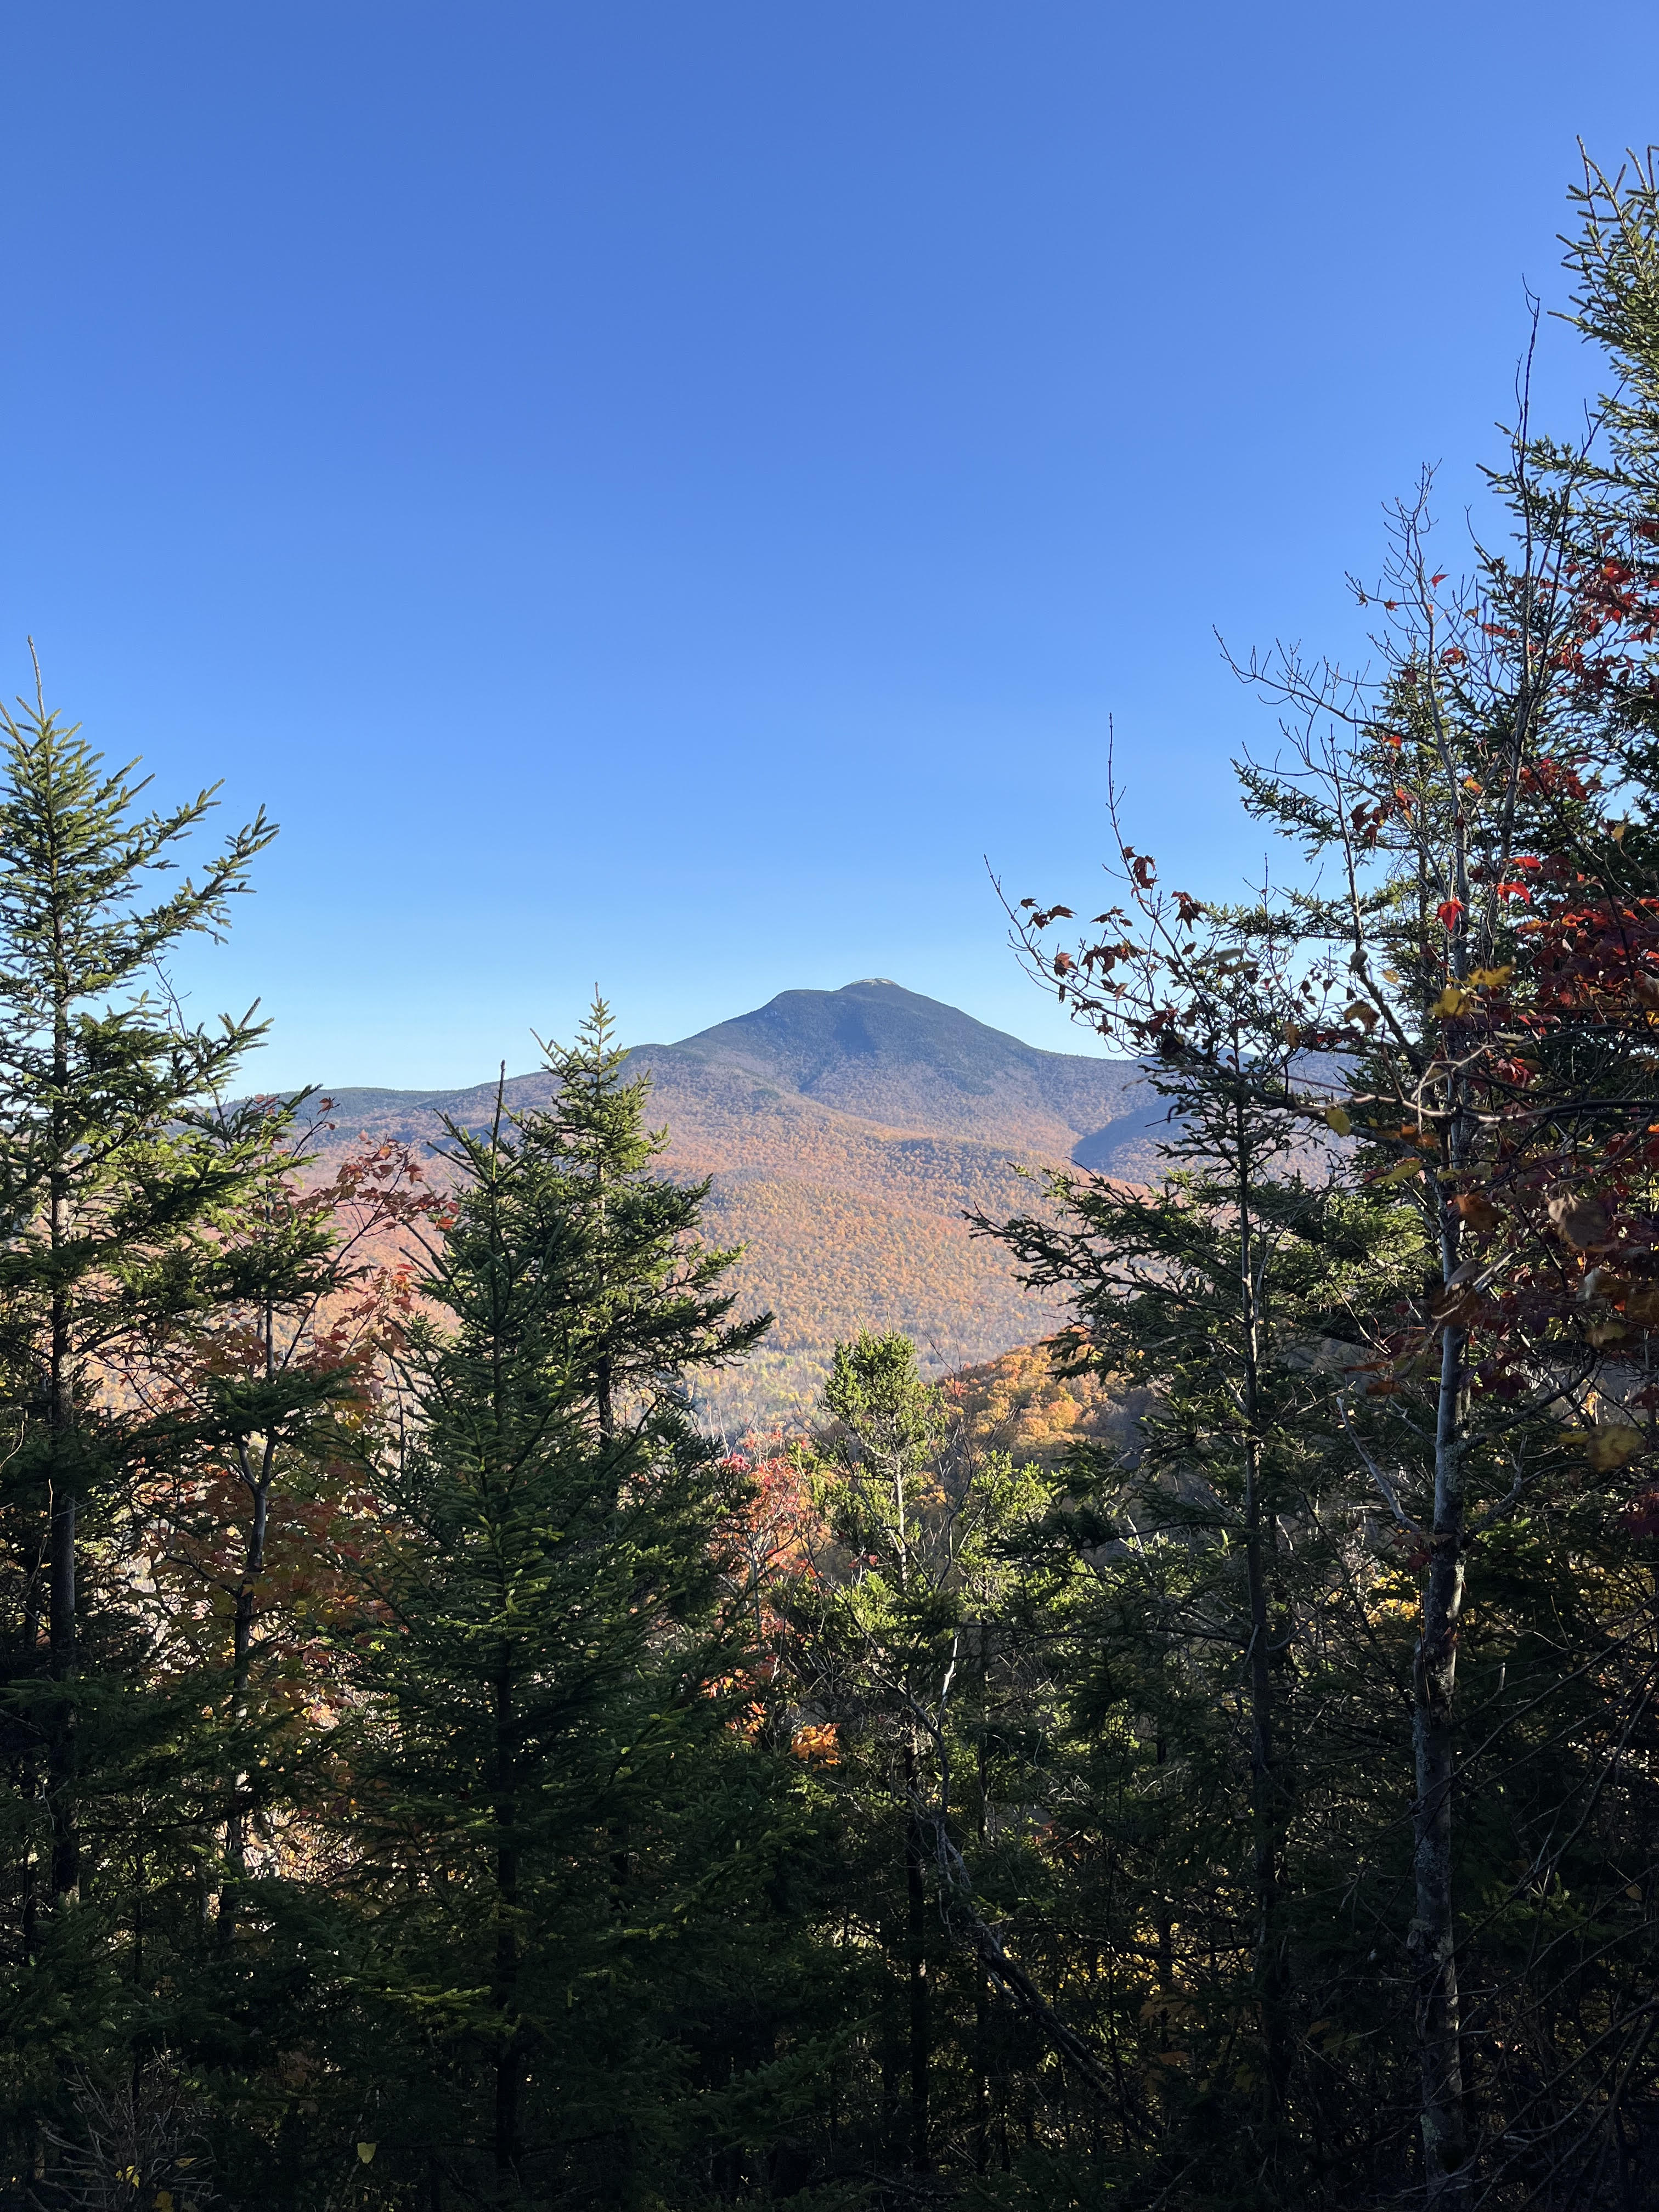
Climate change poses a significant and growing challenge to forest ecosystems across the northeast. While valuable work has been done downscaling projected climate conditions, modeling habitat shifts, and mapping disturbance patterns, these datasets have largely remained separate. This project sought to bring them together — aggregating disparate spatial data to quantify relative climate change exposure at both the species and community level.
The resulting climate exposure maps reveal how potential risk varies across the landscape and among species. Findings show that the highest overall exposure to climate stress, disturbance, and habitat limitations occurs in mountainous regions throughout the northeast and in southeastern Maine. Across the broader region, relative exposure increases by four percent between low and high emission scenarios.
Much of today's forest management is grounded in decades of silviculture research — yet many of the conditions that shaped those findings are rapidly changing. These exposure maps offer a practical tool for identifying where climate adaptation strategies may be most urgently needed, helping managers prioritize action in the landscapes most vulnerable to change.
Scope — All forested acres of New York, New Hampshire, Massachusetts, Maine, and Vermont for 14 regional tree species.
Tools & Methods — The data gathered was prepared using Python and project workflows were automated using ArcPy. The project website was developed from scratch.
Outcome — Many species in the Northern Hardwoods and Spruce-Fir ecosections of the region are likely to face higher exposure with a changing climate, where Mixed Forests are likely to be at an advantage.
Launched in May 2021, Operation Green Tree set out to explore whether localized air quality monitoring was viable for both business and scientific purposes. Using sensors provided by Breeze Technologies (Hamburg, Germany) and their IoT-based data collection platform, the project investigated whether city-level air quality measurements differed meaningfully from state-level data collected by Vermont. With only two state-managed sensors covering the Burlington Metropolitan Area — just one within city limits — there was a clear opportunity to test whether a denser, locally-deployed network could reveal differences invisible at a broader scale. The project also served as a pilot to evaluate Breeze Technologies as a potential long-term business partner, assessing product performance, data reliability, and customer service.
To deploy six sensors across the BMA, we built relationships with local organizations, institutions, and municipalities. In exchange for hosting the sensors, partners received monthly Power BI reports detailing air quality trends across ten factors: temperature, relative humidity, PM2.5, PM10, carbon monoxide, nitric oxide, nitrogen dioxide, ozone, volatile organic compounds, and ammonia. The network first went live on July 25th and collected a data point every 30 seconds, ultimately generating approximately 7.2 million data points over the course of the project.
Managing that volume of data required a purpose-built pipeline. Using Microsoft Azure, we streamed incoming data to a Gen 2 Data Lake, migrated it into a Synapse environment, applied ETL processes via SQL, and visualized trends in Power BI. The project concluded in May 2022 after roughly one year, delivering actionable business insights for our client Arctic IT and a meaningful snapshot of air quality conditions across Burlington, VT.
Scope — Six air quality sensors across northern Vermont
Air Quality Metrics Recorded — Every 30 seconds, each sensor recorded temperature, relative humidity, PM2.5 (fine particulate matter 2.5 micrometers or less), PM10 (larger-sized particulate matter 10 micrograms or less), carbon monoxide, nitrogen monoxide/ nitric oxide, nitrogen dioxide, O3 (ozone), volatile organic compounds, and ammonia
Outcome — Demonstrated that air quality at sites near major roadways is significantly lower than sites even just several blocks away.